Economic & Market Perspective: April 2026
Financial markets are navigating a more uncertain environment, shaped by geopolitical risks, shifting inflation dynamics and evolving policy expectations by the U.S. government. As the first half of 2026 continues to unfold, the U.S. economy remains resilient, yet growth is slowing and inflation risks are re-emerging. This article examines how these dynamics are shaping the economic outlook and influencing market behavior in the months ahead.
Geopolitical Risk: Duration Matters
Throughout March and into April the financial markets have been increasingly influenced by uncertainty around the Iran conflict, particularly the duration of the war and the timing of a reopening of the Strait of Hormuz. A two-week ceasefire announced on April 7 sent oil prices lower and led to a market rally, but with the agreement temporary and tied to the reopening of the Strait, uncertainty around the duration and timing remains.

That uncertainty is keeping energy markets tight. Oil prices have risen from the low $70s per barrel at the end of February to above $118 by the end of March, reflecting not just the initial shock but the lack of a clear resolution. Roughly 20% of global oil consumption passes through the Strait, reinforcing how sensitive markets are to the duration of the disruption.
The result is a more challenging macro backdrop. Higher energy costs are feeding into inflation while beginning to weigh on economic growth expectations. Bond yields have moved higher, and equities have come under pressure as financial markets adjust to higher input costs incurred by businesses and softer demand by consumers.
The key difference this time is scale and persistence. Previous shocks in energy prices were relatively short-lived and did not materially disrupt supply. In this case, damage is ongoing and timelines remain uncertain. While some oil production may return within months, restoring the structurally damaged infrastructure could take significantly longer.
Markets are therefore not only reacting to the magnitude of the shock, but increasingly to its duration, which is likely to keep volatility elevated.
Inflation Expectations
The recent movement in energy prices is expected to be reflected in the Consumer Price Index for March. Headline inflation, which includes all goods and services, specifically food and energy costs, is projected to increase 1.0% month over month, lifting the year-over-year rate to 3.4% from 2.4% in February. Core inflation, which strips out food and energy, is expected to remain more stable at 0.3% month over month.
This divergence between headline and core inflation reinforces the view that while underlying inflation trends remain relatively contained, elevated energy prices may complicate the path forward by the U.S. Federal Reserve and reduce the likelihood of near-term interest rate cuts.
Gross Domestic Product
Looking at the U.S. economic health, Gross Domestic Product (GDP) slowed more than expected in the fourth quarter of 2025. The initial estimate of 1.4% was revised down to 0.7%, well below the roughly 3% consensus expectation.
Much of the weakness was driven by the U.S. government shutdown, which likely reduced growth by approximately one percentage point. Adjusting for that effect, underlying growth was closer to the mid-2% range, indicating the economy remained on relatively solid footing.
Importantly, the current geopolitical conflict in the Middle East is not yet reflected in reported GDP. Instead, its effects are beginning to appear in higher-frequency data, including higher energy prices, softer business activity and signs of moderating growth.
The slowdown is therefore building but has not yet been fully captured in official data.
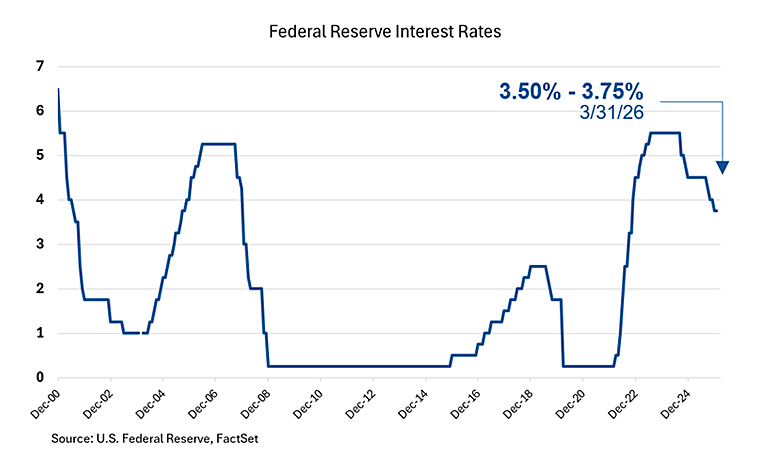
The U.S. Federal Reserve
Against this backdrop, the Fed’s policy path has become more uncertain. The easing cycle began in 2024, followed by a pause, and resumed in late 2025. In total, the Fed has reduced interest rates by 1.75 percentage points over the past two years, from a range of 5.25%–5.50% in August 2024 to the current range of 3.50%–3.75%.
As of late February 2026, markets were pricing in additional cuts in 2026. However, that expectation has shifted meaningfully, with current pricing reflecting little-to-no further easing this year as inflation concerns have reemerged.
The Fed is once again balancing growth that is slowing but still resilient against inflation that remains above target.
Unemployment and the Labor Market
Another key area of focus by the Fed is the labor market, which remains stable. The unemployment rate is 4.3%, and recent payroll data, while uneven, continues to show underlying resilience.
March payrolls increased by 178,000, rebounding from a decline in February that was likely influenced by temporary factors, such as severe weather and a healthcare worker strike. The March jobs report is unlikely to capture any meaningful impact from the evolving geopolitical situation, as hiring decisions tend to lag. The broader dynamic is one of slower hiring, but limited layoffs. This “low-hire, low-fire” environment is supporting stability in the labor market.
Job growth has become more concentrated, with strength in sectors such as healthcare, construction and transportation, and some softness in areas like financials. Labor force participation remains relatively stable at 61.9%, though it has drifted modestly lower from 62.5% late last year, likely reflecting factors such as an aging population and slower immigration.
Overall, the labor market is no longer accelerating, but it is not weakening in a meaningful way.
U.S. Consumers: Resilient but Uneven
Overall, U.S. consumers remain resilient, but their supports, such as household savings and wage growth are shifting and their experiences are increasingly uneven across income groups.
Higher energy costs and tariffs are gradually flowing into prices for consumer goods and services, and disproportionately affecting lower-income households. At the same time, changes to government programs and benefits are reducing support at the lower end of the income distribution.
Higher-income households remain more insulated, reflecting stronger balance sheets and greater exposure to financial assets. However, the wealth effect is beginning to fade. When stock markets, home prices and cryptocurrencies were rising, consumers felt wealthier and spending was stronger. That tailwind is no longer as strong.
Equity and Fixed Income Markets
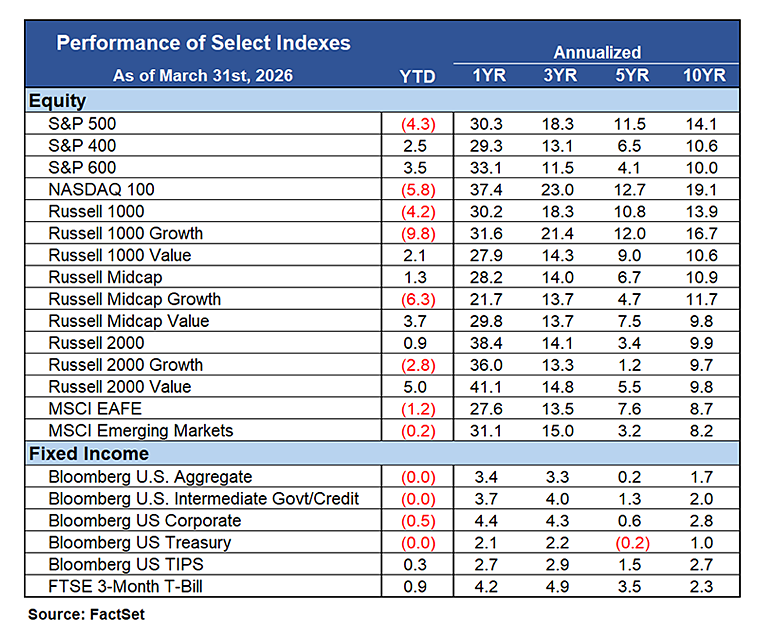
Equity market performance has been uneven in 2026, with large caps lagging meaningfully. The S&P 500® Index declined 5.0% in March and is down 4.3% year to date, while the equal-weight S&P 500 Equal Weight Index—which gives the same fixed weight to each of the 500 companies regardless of their size—is roughly flat, up 0.7%. Mid- and small-cap equities have outperformed large caps, with the S&P MidCap 400 Index up 2.5% and the S&P SmallCap 600 Index up 3.5%.
A key driver of this divergence has been weakness in the “Magnificent Seven,” which have declined approximately 12% year to date, with four of the seven (Microsoft, Tesla, Apple and Alphabet) down double digits. Given that these companies still represent roughly one-third of the S&P 500 by market capitalization, their underperformance has been a significant drag on index-level returns.
Valuations have also adjusted meaningfully. Large caps are currently trading at approximately 19.5x earnings, down from roughly 25x at the start of the year, but still at a premium to mid-caps (16.5x) and small-caps (18.5x). In March, this repricing was driven by multiple contractions, even as earnings expanded across all 11 sectors.
Earnings Growth Broadens
From an earnings perspective, the outlook remains strong. S&P 500 earnings are projected to grow approximately 16% in 2026, with estimates revised higher by about 1.8% year to date, despite geopolitical uncertainty. While the Magnificent Seven are still expected to contribute a meaningful share of this growth, their influence is moderating, with projected earnings growth of roughly 18%, closer to the 13% expected for the rest of the Index.
Importantly, earnings growth is broadening beyond mega-cap technology. Mid- and small-cap companies are expected to deliver double-digit growth, with S&P 400 earnings projected to rise 19.6% and S&P 600 earnings 15.6%. Unlike large caps, where technology remains the primary driver, growth in mid- and small-caps is expected to be more cyclical, led by sectors such as financials, materials, and energy.
Fixed income markets have adjusted to the shift in inflation expectations. Treasury yields have moved higher as markets reprice the likelihood of fewer interest rate cuts and incorporate a higher-for-longer inflation backdrop.
This has resulted in more attractive yields, but also greater sensitivity to inflation data and policy expectations. The path of rates remains closely tied to energy prices and the persistence of inflation pressures.
Private Credit
Markets have become more focused on risks within private credit, particularly around sector concentration and exposure to more leveraged borrowers. Liquidity has been the primary issue thus far, as managers have been unable to meet redemption requests.
The significance is less about any single area of stress and more about what it signals for broader financial conditions. If lending standards tighten, capital becomes more selective, which can weigh on growth at the margin.
This environment tends to favor higher-quality companies with stronger balance sheets, particularly if tighter credit conditions begin to extend beyond private markets.
Outlook
2026 is shaping up to be a year where fundamentals matter more. Growth is slowing from recent highs, but remains resilient. Inflation is moderating unevenly, leaving less room for policy support. The labor market is stable, but not a source of strength. At the same time, market leadership is beginning to broaden beyond a narrow group of dominant companies.
Risks around geopolitics, trade policy and fiscal dynamics remain, but the path of the current conflict is a key variable. Until there is greater clarity on its duration and economic impact, financial markets are likely to remain sensitive to both growth and inflation.
In this environment, earnings quality and valuation discipline are likely to be the primary drivers of returns.
Jamie Zendel is EVP, Head of Quantitative Strategies and Asset Allocation Strategies, at Mutual of America Capital Management LLC.
Past performance is no guarantee of future results. The index returns discussed above are for illustrative purposes only and do not represent the performance of any investment or group of investments. Indexes are unmanaged and not subject to fees or expenses. The index returns above reflect the reinvestment of distributions. It is not possible to invest directly in an index.
The views expressed in this article are subject to change at any time based on market and other conditions and should not be construed as a recommendation. This article contains forward-looking statements, which speak only as of the date they were made and involve risks and uncertainties that could cause actual results to differ materially from those expressed herein. Readers are cautioned not to rely on our forward-looking statements.
The information has been provided as a general market commentary only and does not constitute legal, tax, accounting, other professional counsel or investment advice, is not predictive of future performance, and should not be construed as an offer to sell or a solicitation to buy any security or make an offer where otherwise unlawful. The information has been provided without taking into account the investment objective, financial situation or needs of any particular person. Mutual of America is not responsible for any subsequent investment advice given based on the information supplied.
Mutual of America Capital Management LLC is an indirect, wholly owned subsidiary of Mutual of America Life Insurance Company. Insurance products are issued by Mutual of America Life Insurance Company, 320 Park Avenue, New York, NY 10022-6839. Mutual of America Securities LLC, Member FINRA/SIPC distributes securities products. Mutual of America Retirement Services LLC provides administrative and recordkeeping services. Mutual of America Financial Group is the trade name for the companies of Mutual of America Life Insurance Company.