A Closer Look: Which Way Are Inflation and Interest Rates Heading?
Momentum in the financial markets has shifted in recent months. In December, the U.S. Federal Reserve lowered its target level for short-term interest rates to a range of 3.5 to 3.75%, and projected that it would probably lower rates once more, by a quarter of a percentage point, by the end of 2026. Implied rates in federal funds futures markets, however, indicated that market participants thought that two or three such interest rate reductions were more likely by year-end 2026.
Following the Federal Open Market Committee’s (FOMC) most recent policy meeting at the end of April, however, futures markets now imply no rate reductions in 2026—in fact, none through July of next year. Notice how in Figure 1, the green line—which represents futures traders’ projection of where they think the short-term interbank lending rate will be in the next 14 months—remains well within the Fed’s current target range of 3.5 to 3.75%, whereas the dotted blue line—which represents futures traders’ projection back in December—dropped to below 3% by July 2027.
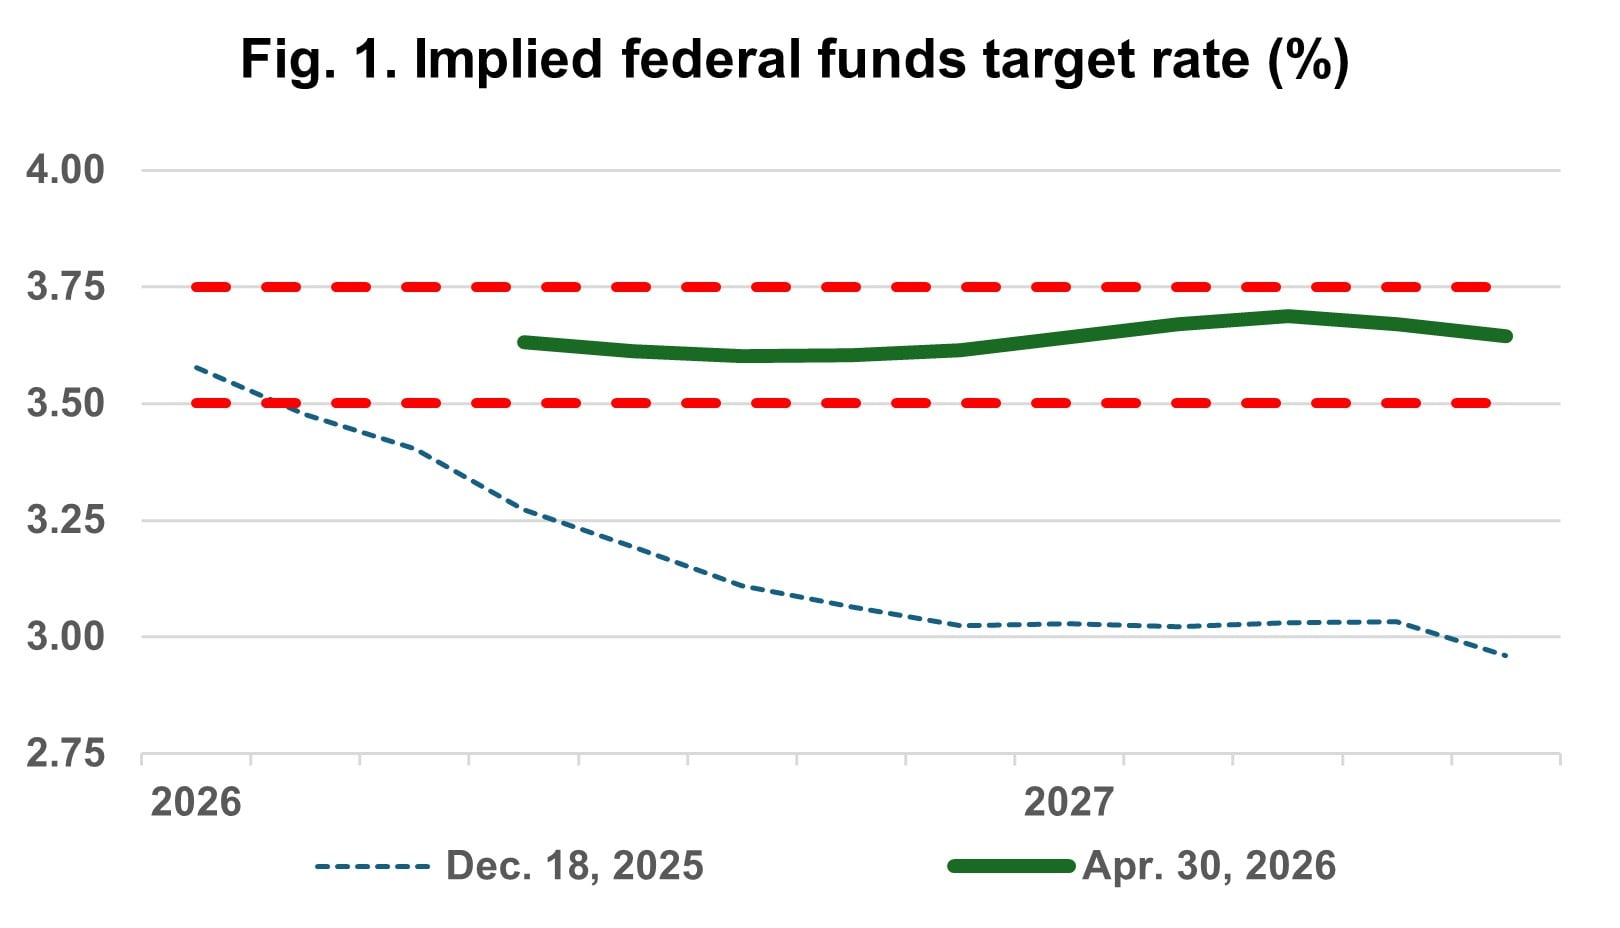
Source: Bloomberg
The change in the market’s assessment of future interest rate policy reflects a shift in thinking among FOMC members. Until recently, Fed policymakers had debated when they would next lower short-term interest rates again. At their most recent policy meeting, however, they disagreed over whether the next change in interest rates will go lower or could instead move higher. Or, in Fed-speak, the easing bias in place since September 2024 may soon come to be replaced by a more symmetric policy outlook.
Underlying economic fundamentals make clear the reason for the shift. In short, the overall economy—including the labor market—appears to be in better shape than some news headlines suggest, and inflation has been on the rise again, even before the conflict began in Iran in February, causing energy prices to surge.
Economic growth
Higher oil prices generally act as a headwind to economic growth. However, based on the recently released GDP report for the first quarter of 2026, it would appear that the impact of higher energy prices is far more than offset by increases in AI-related capital investment and incentives from the 2025 U.S. budget reconciliation law often referred to as One Big Beautiful Bill. GDP growth in the first quarter was 2.0%, up meaningfully from the 0.5% rate set in the fourth quarter of 2025. That rate was unusually low due to the federal government shutdown, which economists estimated resulted in a negative impact of around 1%. Notably, final sales to private domestic purchasers (FSPDP), a metric that filters out some of the effects of changes in trade due to tariffs, came in at 2.5% in the first quarter, up from 1.8% in the fourth quarter of 2025 (see Figure 2).
Energy prices would have to increase a great deal more to meaningfully slow down economic growth. It’s worth noting that in the early 2010s, oil prices were comparably high to today’s elevated levels, yet economic growth during that time came in at approximately 2 percent. In inflation-adjusted terms, today’s oil prices are well below oil prices set in the early 2010s. And today’s U.S. economy uses less energy per unit of GDP than it did back then.
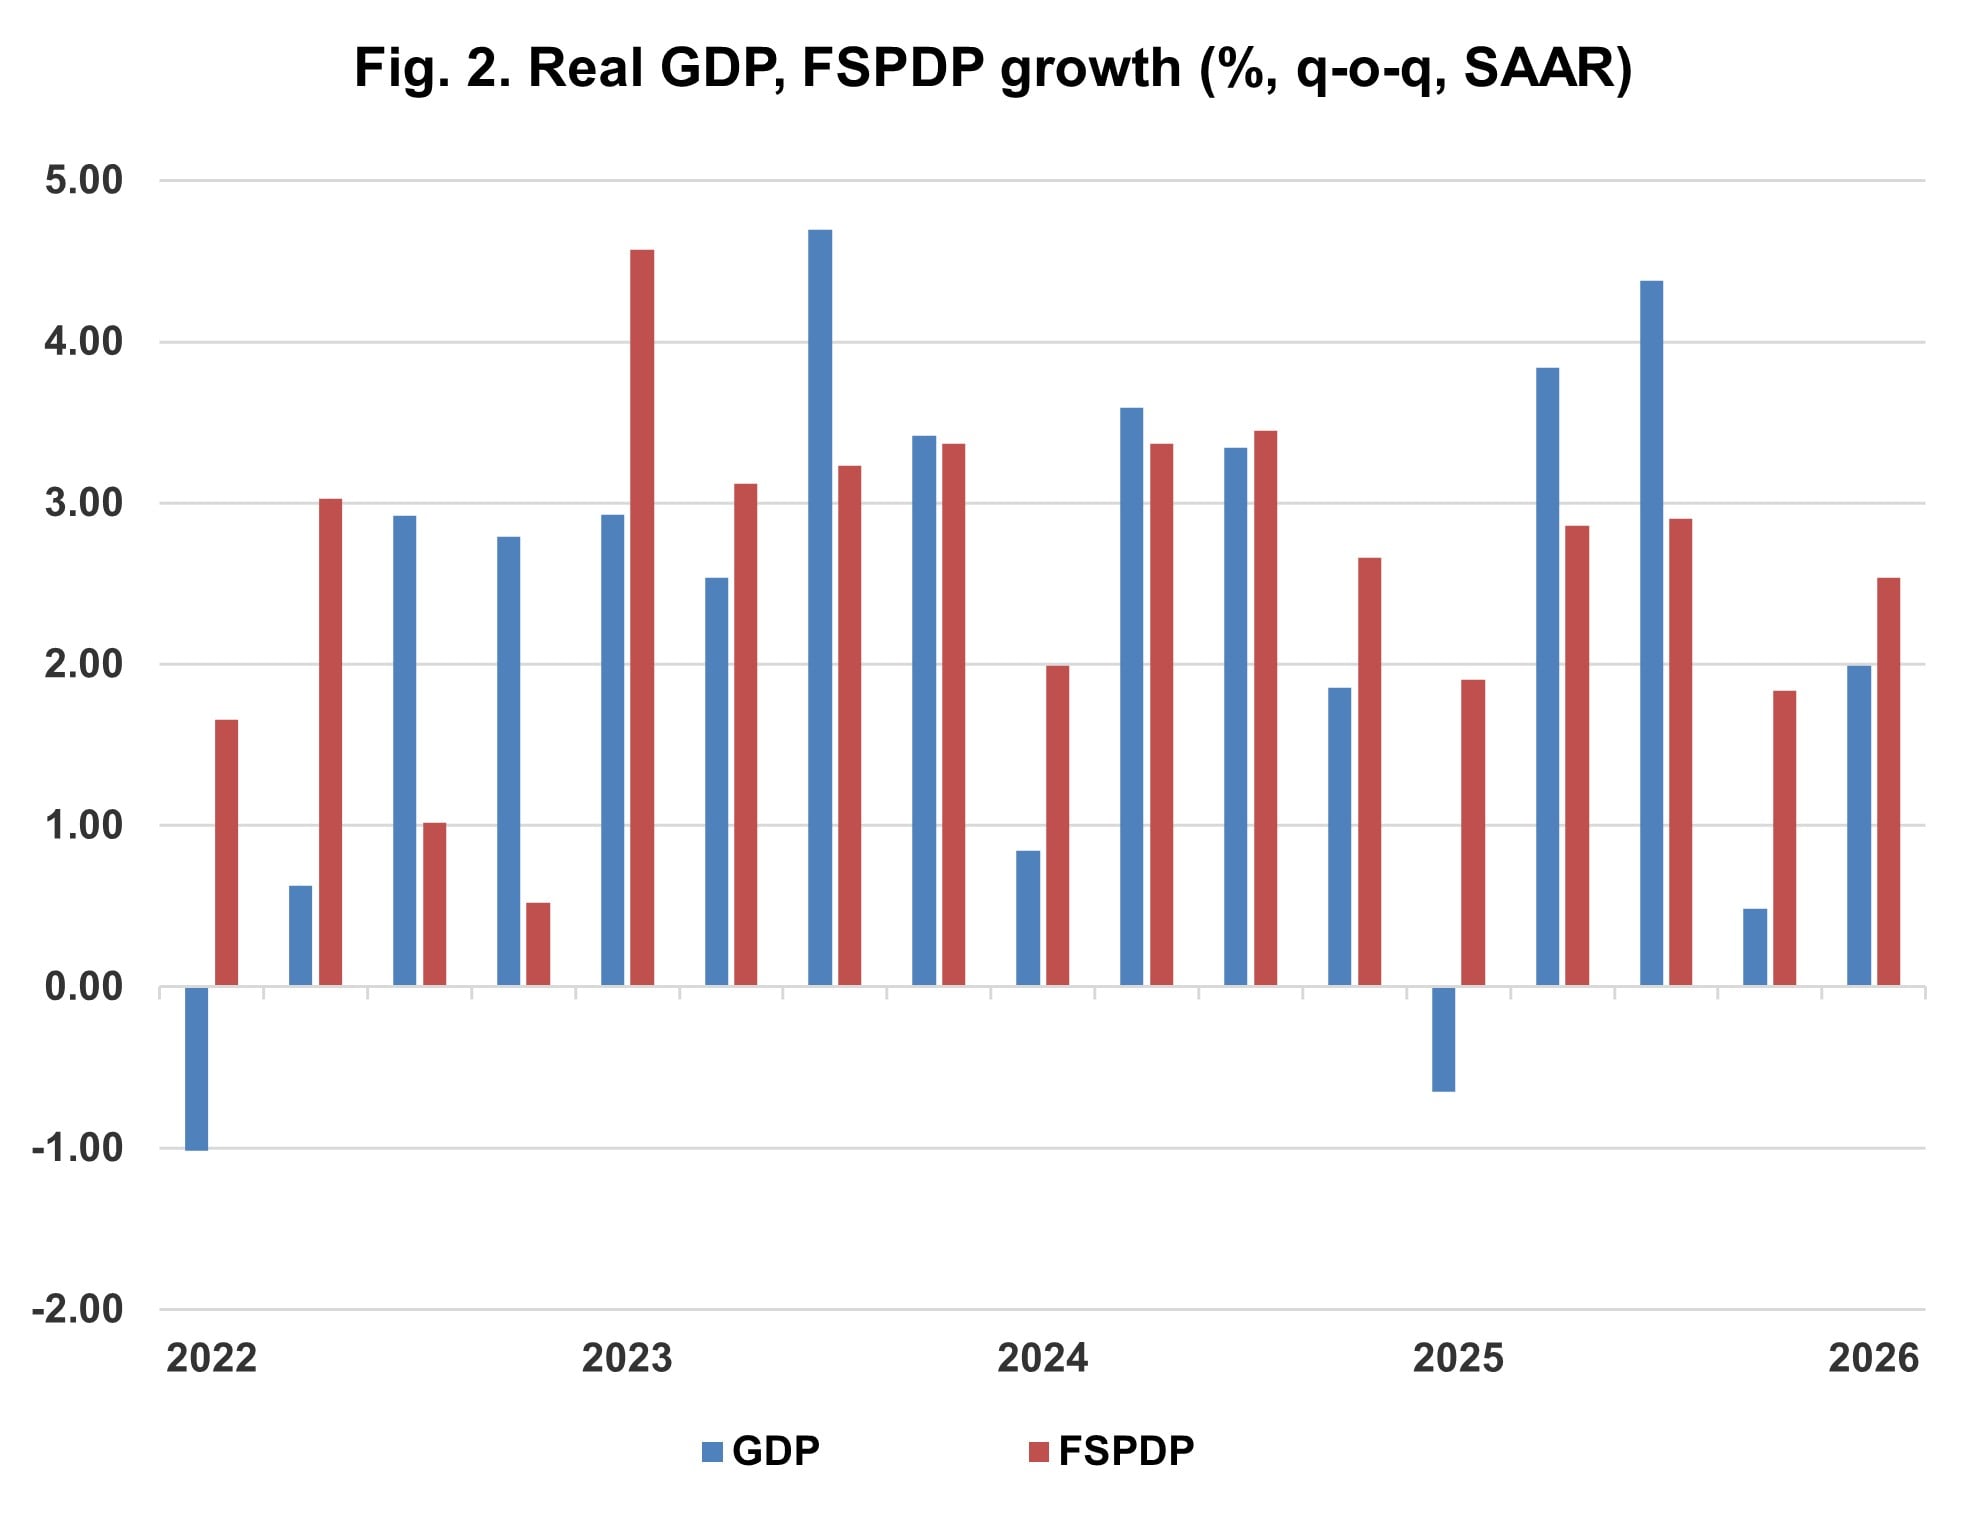
Source: Bureau of Economic Analysis
Employment
The jobs situation has likewise been better than news headlines may suggest. Monthly job growth numbers aren’t quite as high as they once used to be (Figure 3). However, this is largely due to the fact that the U.S. labor force is growing at a slower pace, as baby boomers continue to retire, and as the foreign-born segment of the labor force has declined over the past year or so. Although the total number of nonfarm payrolls has been flattening out at approximately 158 million (Figure 4), the fact that the unemployment rate has remained largely unchanged in recent months indicates that low monthly job growth numbers reflect a decline in the supply of labor rather than in the demand for workers. For that reason, economists now consider the unemployment rate a better gauge than the monthly change in jobs. At 4.3% in April, the unemployment rate remains low by historical standards.
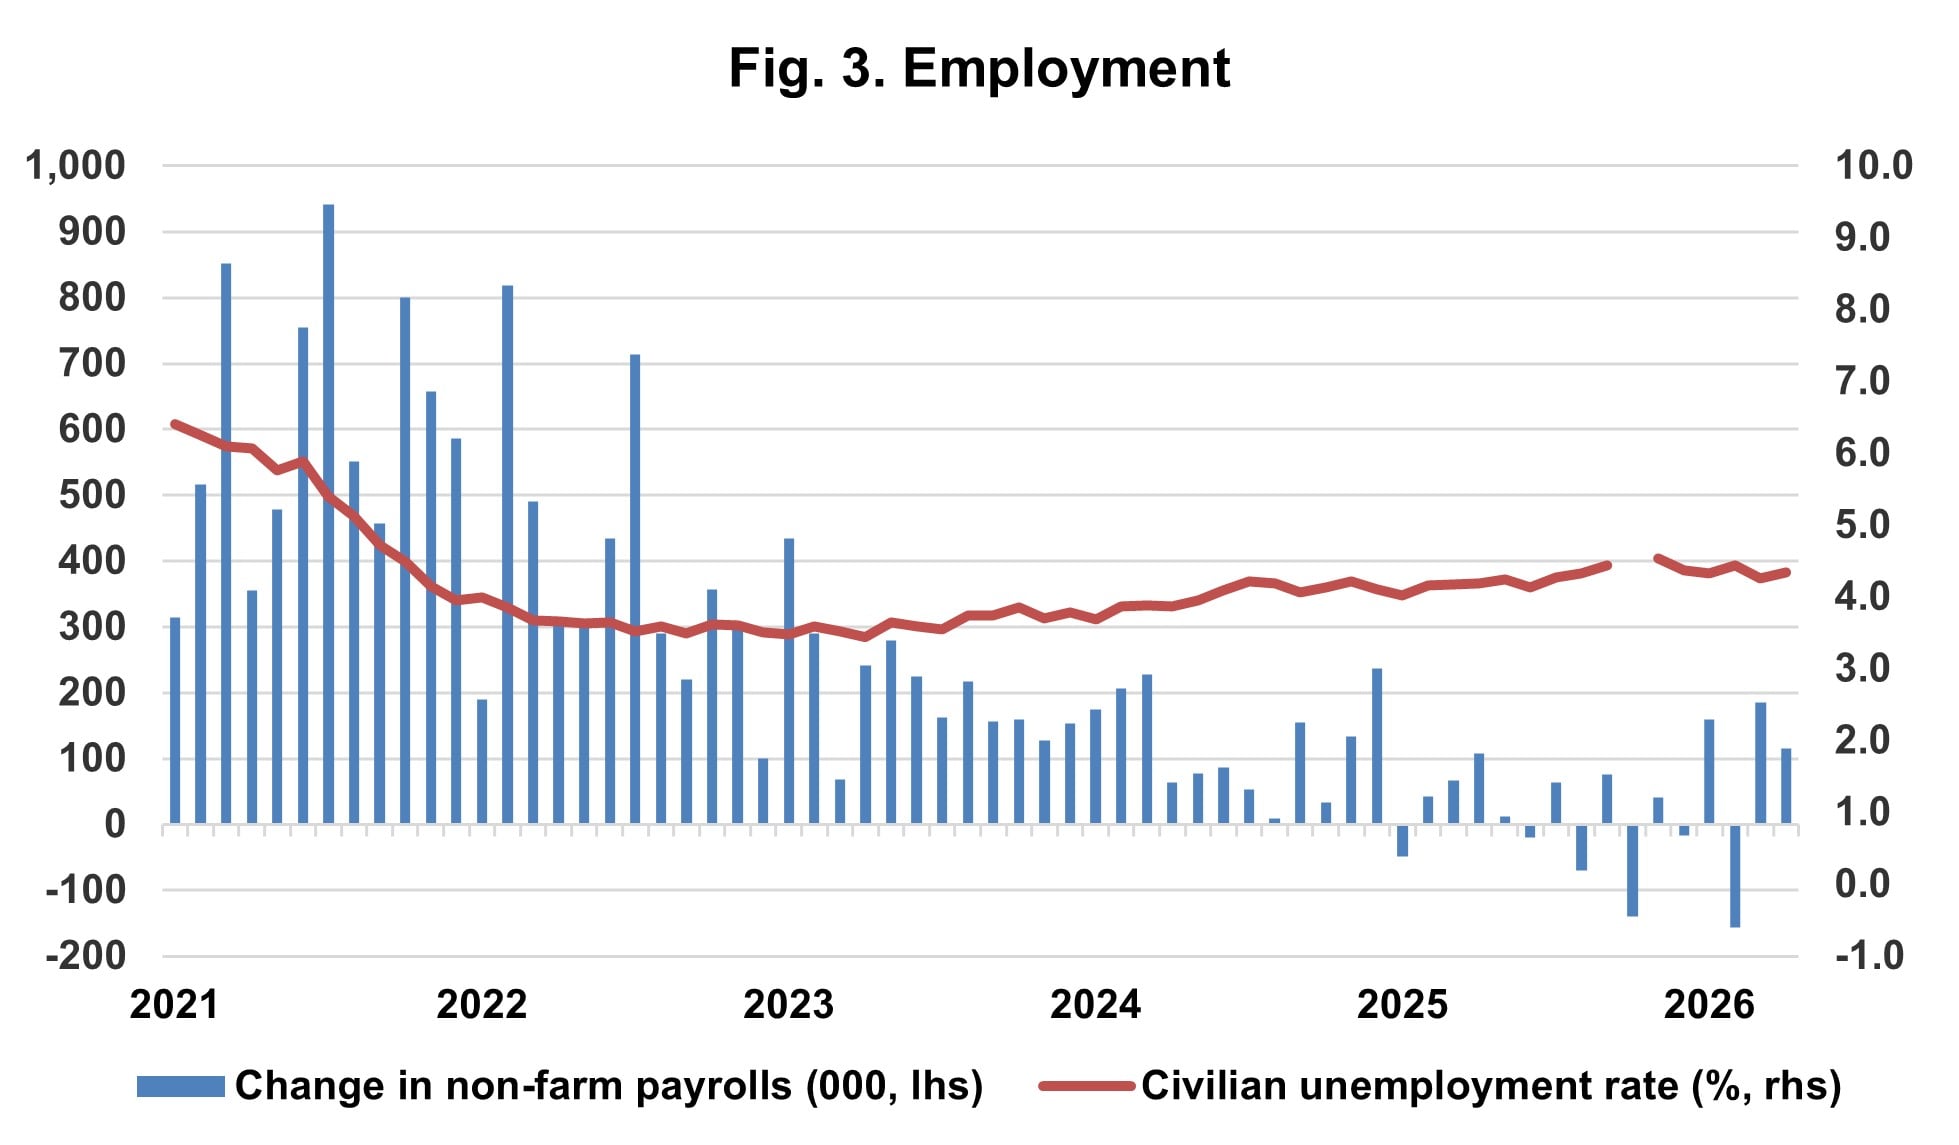
Source: Bureau of Labor Statistics
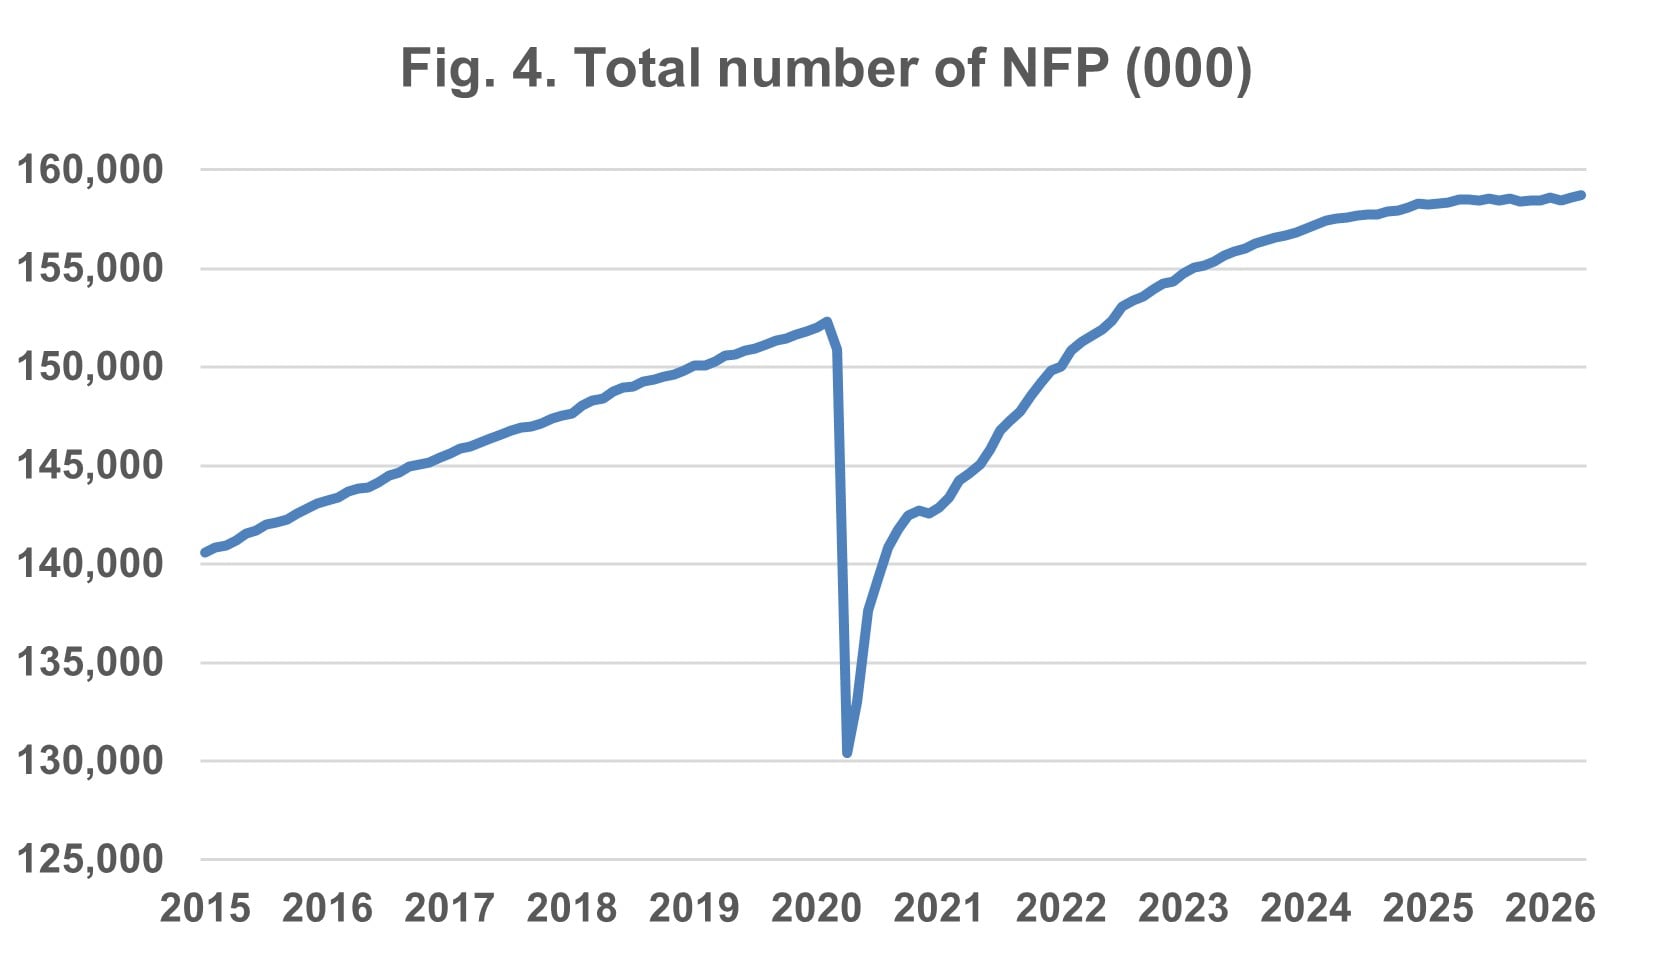
Source: Bureau of Labor Statistics
Inflation
Affordability remains a major problem affecting the U.S. economy. The Personal Consumption Expenditures (PCE) Price Index, which is the Fed’s preferred inflation gauge and measures the change in prices for goods and services consumed by households, was up 8.3% in March (stated on an annualized basis). This high level was due largely to the increase in energy prices brought on by the conflict in Iran. Standard central banking practice is to “look through” such one-time jumps, on the assumption they don’t repeat. When oil prices were elevated in the early 2010s, the initial spill-over effect on overall consumer prices remained subdued, and inflation returned to the Fed’s target fairly quickly.
This time, however, it may not be quite that straightforward.
- Inflation has been rising steadily since November, well before the conflict in Iran began in late February. The inflation rate for personal consumption expenditures other than food and energy came in at 3.70% for the past 6 months, which is well above what most people would consider price stability.
- Inflation has been driven mainly by goods, rather than services, recently (Figure 5), an increase that many economists attribute to tariffs. Tariff-induced price increases presumably are also one-time, non-repeating events. Still, inflation in services is where the real problem lies. As the labor supply decreases, especially in services, it pushes up wages, which business owners seek to recoup by raising prices for consumers. According to the U.S. Bureau of Labor Statistics, average hourly earnings increased by 3.6% year-over-year in April.
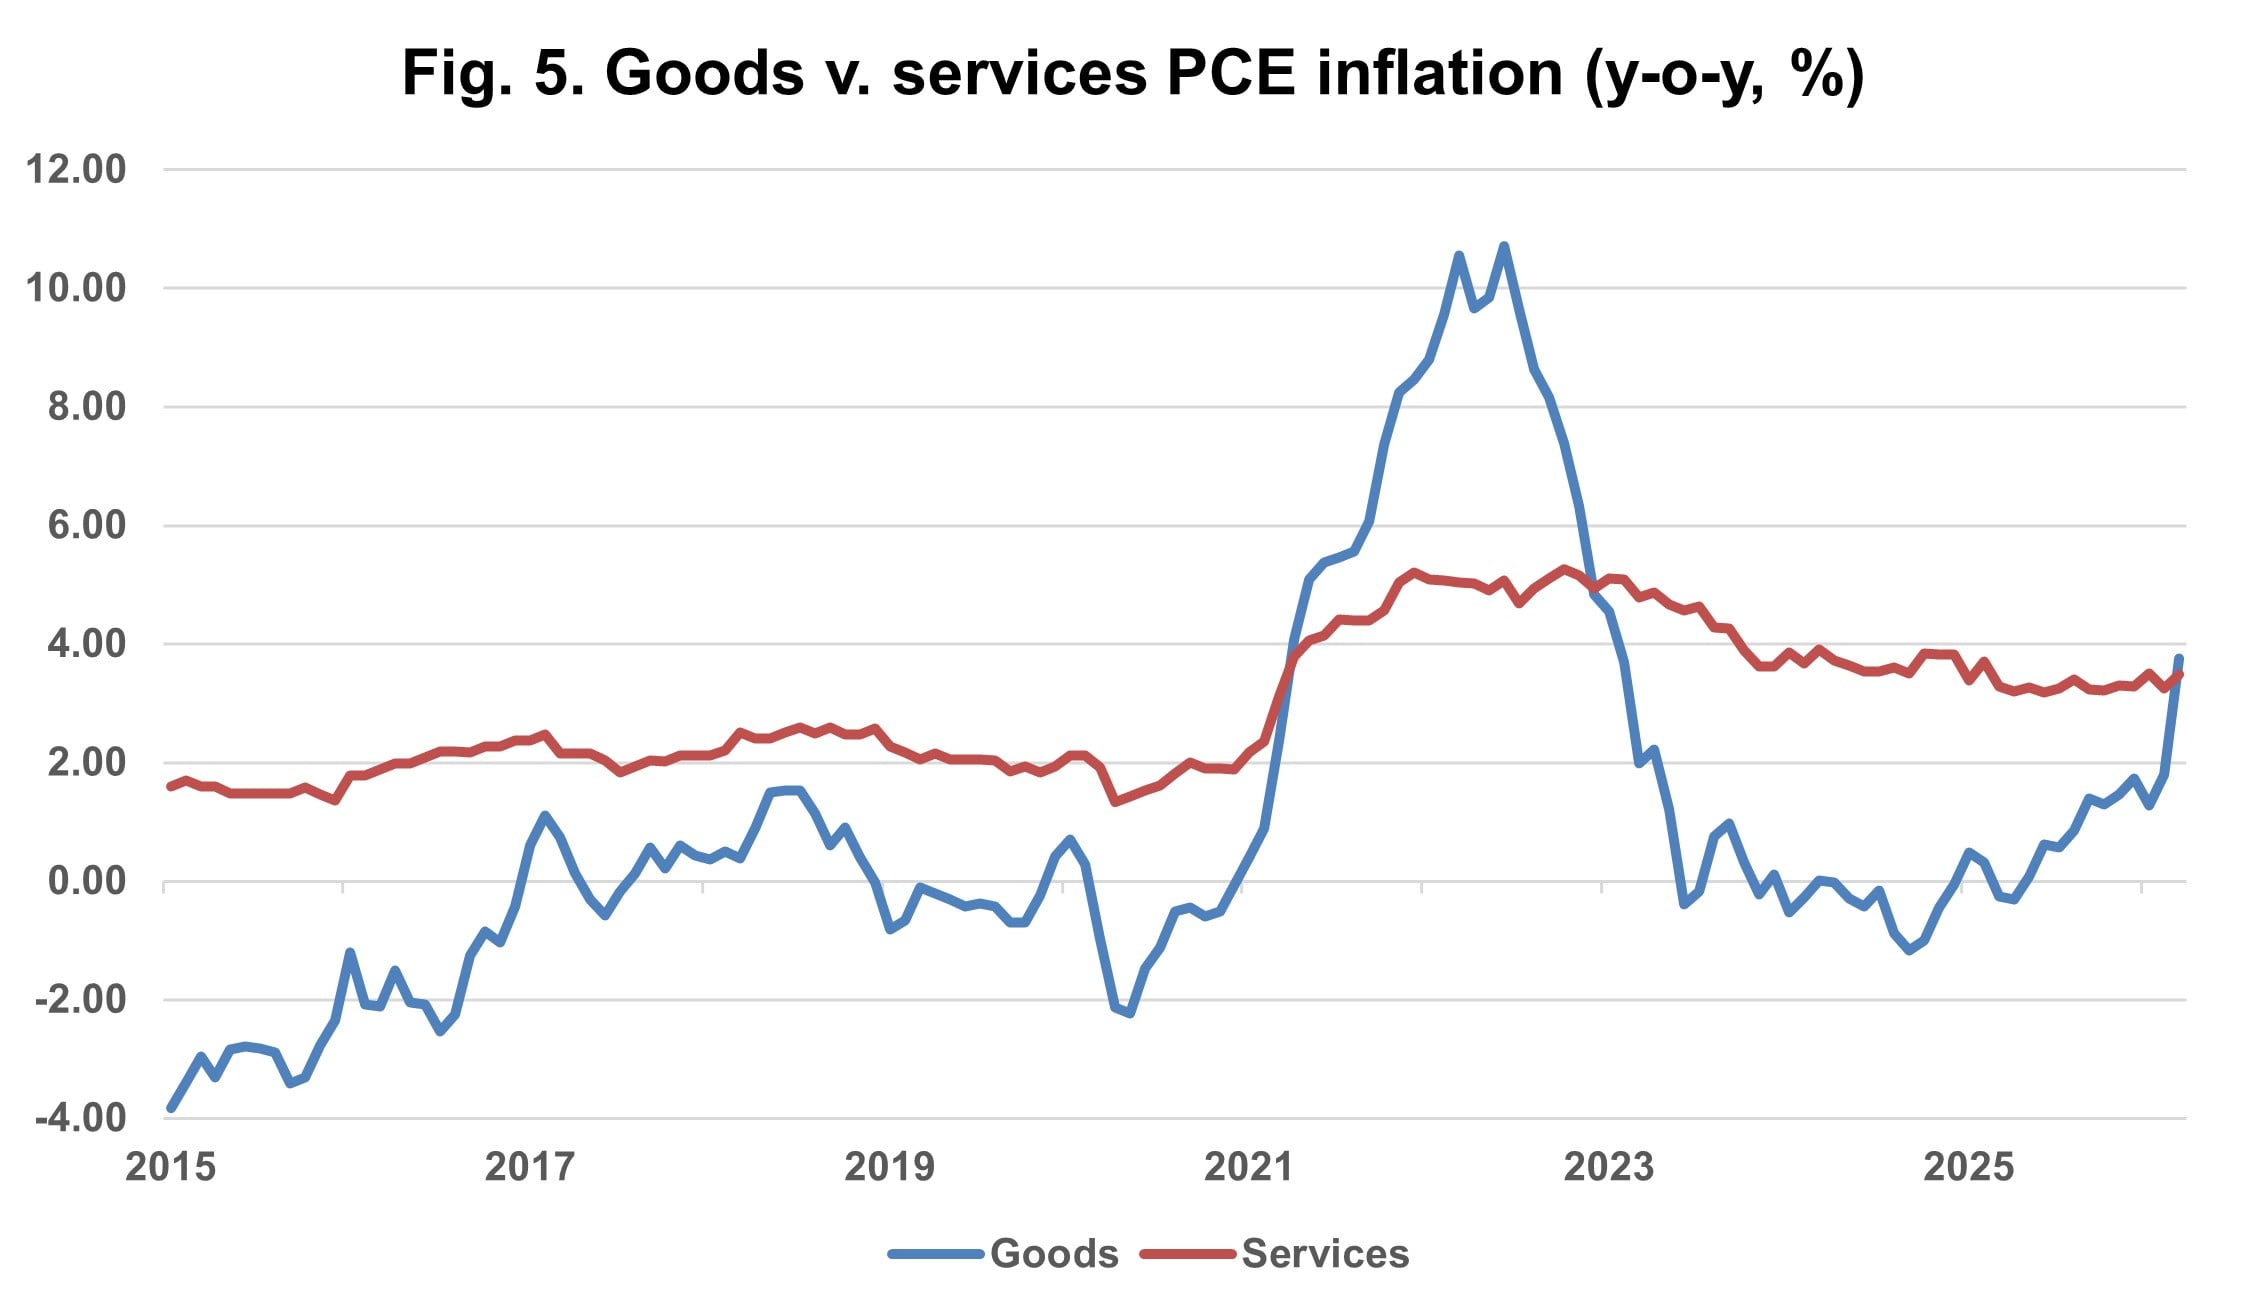
Source: Bureau of Economic Analysis
Perhaps most concerning is that inflation is on the rise again only a few years after the price spike of 2021–2022. As a result, inflation expectations are creeping higher again as well, which makes it easier for companies to push through price increases that they might otherwise be less inclined to implement out of fear of losing market share (Figure 6).
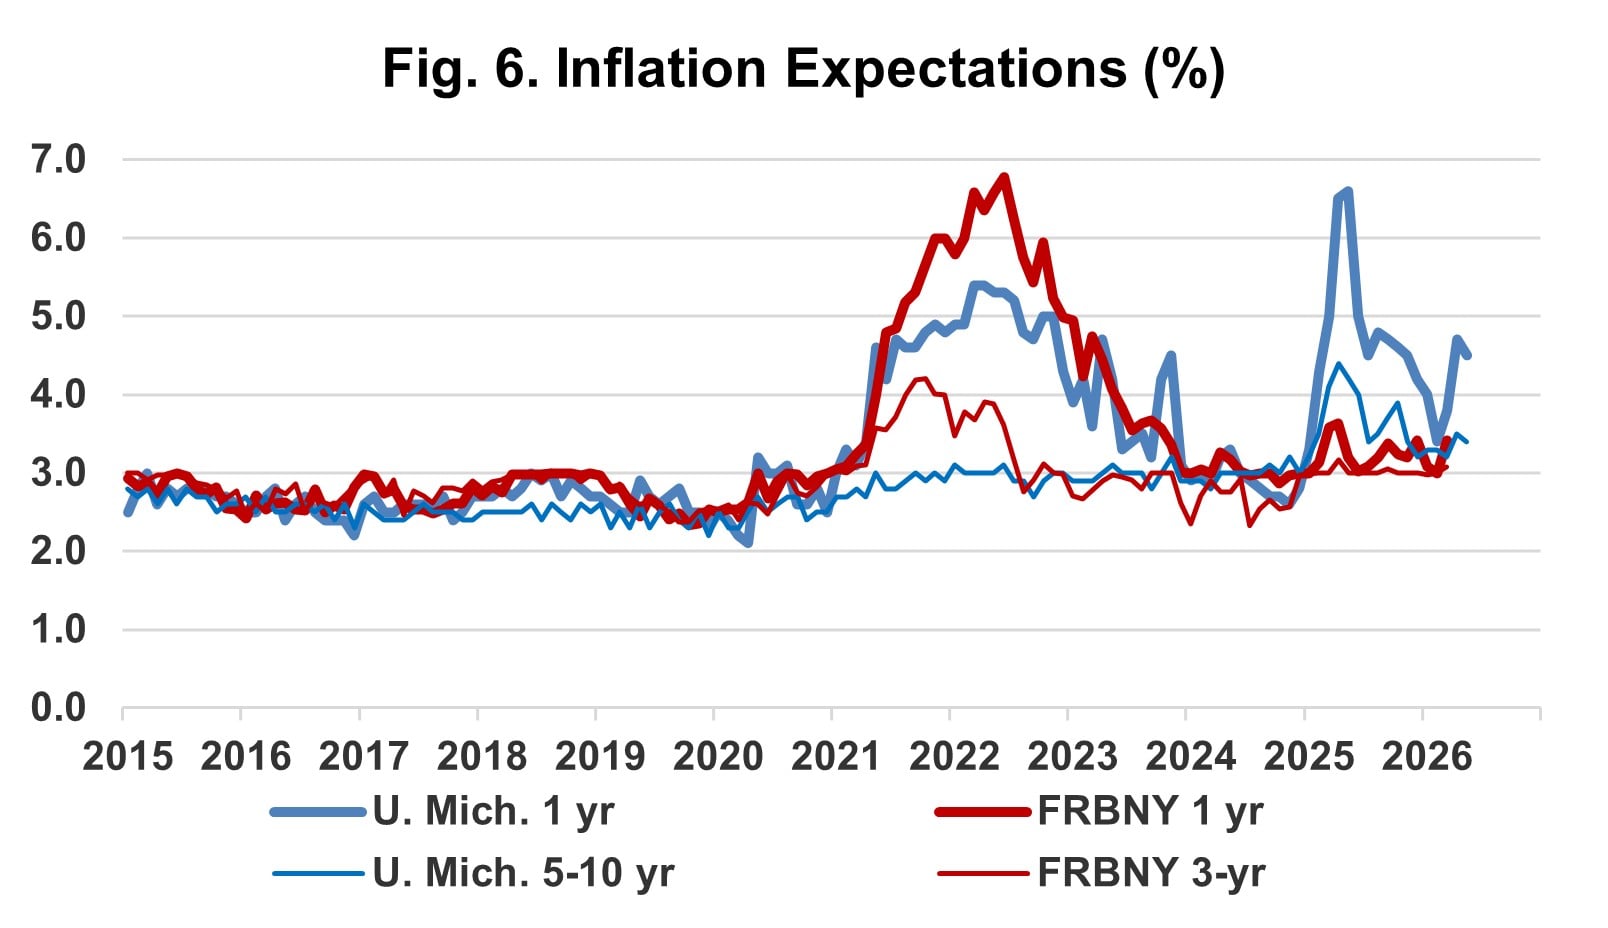
Sources: University of Michigan, Federal Reserve Bank of New York
Back in the 1970s, an era remembered today as a single period of inflation combined with high unemployment, there were in fact two spikes in inflation—one in 1973–1974 and another in 1979–1981. The Fed has done a commendable job bringing inflation down from the levels set in 2021–2022. But its job is not finished just yet.
Jerry H. Tempelman is Vice President, Economic and Fixed Income Research at Mutual of America Capital Management LLC where he is a credit analyst of financial institutions (banks, insurance companies, real estate investment trusts) with the Company. Previously, he was a credit strategist with Moody’s Analytics, and a Senior Financial and Economic Analyst with the Federal Reserve Bank of New York.
The views expressed in this article are subject to change at any time based on market and other conditions and should not be construed as a recommendation. This article contains forward-looking statements, which speak only as of the date they were made and involve risks and uncertainties that could cause actual results to differ materially from those expressed herein. Readers are cautioned not to rely on our forward-looking statements.
The information has been provided as a general market commentary only and does not constitute legal, tax, accounting, other professional counsel or investment advice, is not predictive of future performance, and should not be construed as an offer to sell or a solicitation to buy any security or make an offer where otherwise unlawful. The information has been provided without taking into account the investment objective, financial situation or needs of any particular person. Mutual of America is not responsible for any subsequent investment advice given based on the information supplied.
Mutual of America Capital Management LLC is an indirect, wholly owned subsidiary of Mutual of America Life Insurance Company. Insurance products are issued by Mutual of America Life Insurance Company, 320 Park Avenue, New York, NY 10022-6839. Mutual of America Securities LLC, Member FINRA/SIPC distributes securities products. Mutual of America Retirement Services LLC provides administrative and recordkeeping services. Mutual of America Financial Group is the trade name for the companies of Mutual of America Life Insurance Company.